


Cultural relevance
It does not feel controversial to suggest that there should be some relationship between the value of cars and their cultural relevance. Popularity on posters and appearance in films are often cited as justifications of value and perhaps necessary conditions of iconic status. Long-term demand for the Ferrari Testarossa and Lamborghini Countach, for example, is arguably heavily derived from these dynamics.
This is the basis of the adage that car prices start appreciating when the children who yearn for them are old enough to buy them. Yet it is becoming harder to observe for several reasons. Firstly, the plethora of super- and hypercars available today dilutes the impact of any individual model. Secondly, enthusiast engagement is perhaps becoming less concentrated on the very latest models. And, furthermore, explosive wealth generation from new industries is condensing the cycle.
Of course, once a pattern is identified, paired with convincing intuition and widely disseminated, any profit potential is likely to be arbitraged away. Yet this is not to say that there is no relationship, or that there is nothing to learn from exploring the idea further.
The data available to analyse cultural relevance is growing exponentially with online media. YouTube is arguably the best source given its breadth and depth, and its relatively young userbase implies that there is a long-term, forward-looking signal.
YouTube data
Via a Google API, we search for the all-time most viewed videos under a search string for every relevant model. To avoid cross-model contamination, we retrieve the top 50 videos per model, clean the dataset and sum the views of only the top 25 videos. This is necessary because, for example, a search for Bugatti Veyron will retrieve many videos about the Chiron driven by the recommendation engine. Likewise, a search for the Ferrari 599 yields a video about the Daytona SP3, because its 599-unit limited run was mentioned in the title. Given the power-law distribution of views (the top 25 have 86% of the views of the top 50), summing views of the top 25 videos arguably provides a sensible approximation of the total engagement for each model.
The search strings and conditions are carefully curated, understanding how the algorithm treats semantic formatting (for example, dashes and spaces) to ensure that viewer numbers are not understated due to multiple naming conventions. Short or generic model names must include the manufacturer, so while “Veyron” is considered a sufficient reference of the Bugatti, videos about a P1 must be referenced as “McLaren P1”.
An inherent issue with this method is the overlap of nested model names. For example, a search for the “Ferrari Daytona” will find videos of the original 365 GTB/4 as well as the Daytona SP3 Icona Series car, two distinct models and markets. The broader Ferrari Daytona results have been removed from the individual model analysis; because our data is the top 25 videos, the results cannot be subtracted, and Boolean search operators have been avoided for consistency.
An important characteristic of this dataset is that the car is not necessarily the primary subject of the videos. This is consistent with the objective of the analysis, which is to find a quantifiable indicator of the cultural importance of different models. For example, Brazilian funk artist MC Ryan SP’s song “Um Dia Vai Chegar o Dia” accounts for 19 million of 154 million views of the top 25 videos referencing the Porsche 918 Spyder, as the car features prominently in the lyrics about self-made success. Thus, this is a highly unique data source, which amalgamates many types of reference into individual data points.
Market cap data
For the purposes of considering YouTube views, and cultural relevance in general, it makes intuitive sense to evaluate the total market footprint, rather than price. This way, an abundant model like the 911 ($168bn) can be compared to a scarce model like the Carrera GT ($4bn).
For each model variant (for example, Bugatti Veyron Grand Sport Vitesse), a global average price is calculated from proprietary data and multiplied by the estimated production volume. Where cars are very old or have weathered a period of low valuations, a survival population is estimated. For example, 119k of 179k Porsche 996s built are estimated to survive today; over 93% of GT2s but only 60% of base Carreras. Market cap data can be viewed and analysed on CollectorCar.Market.
The results
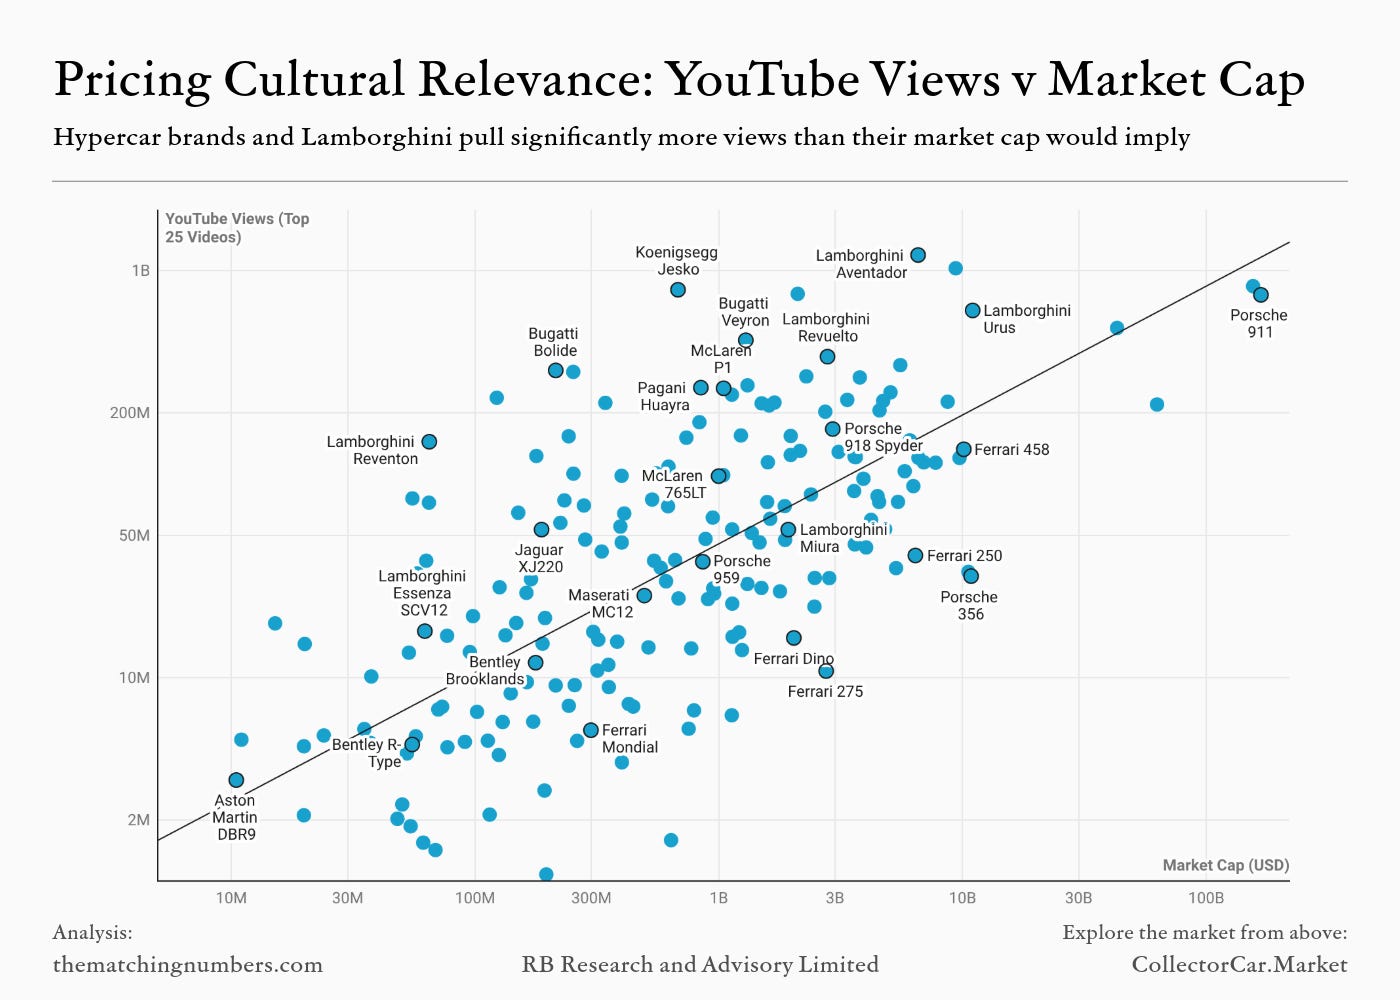
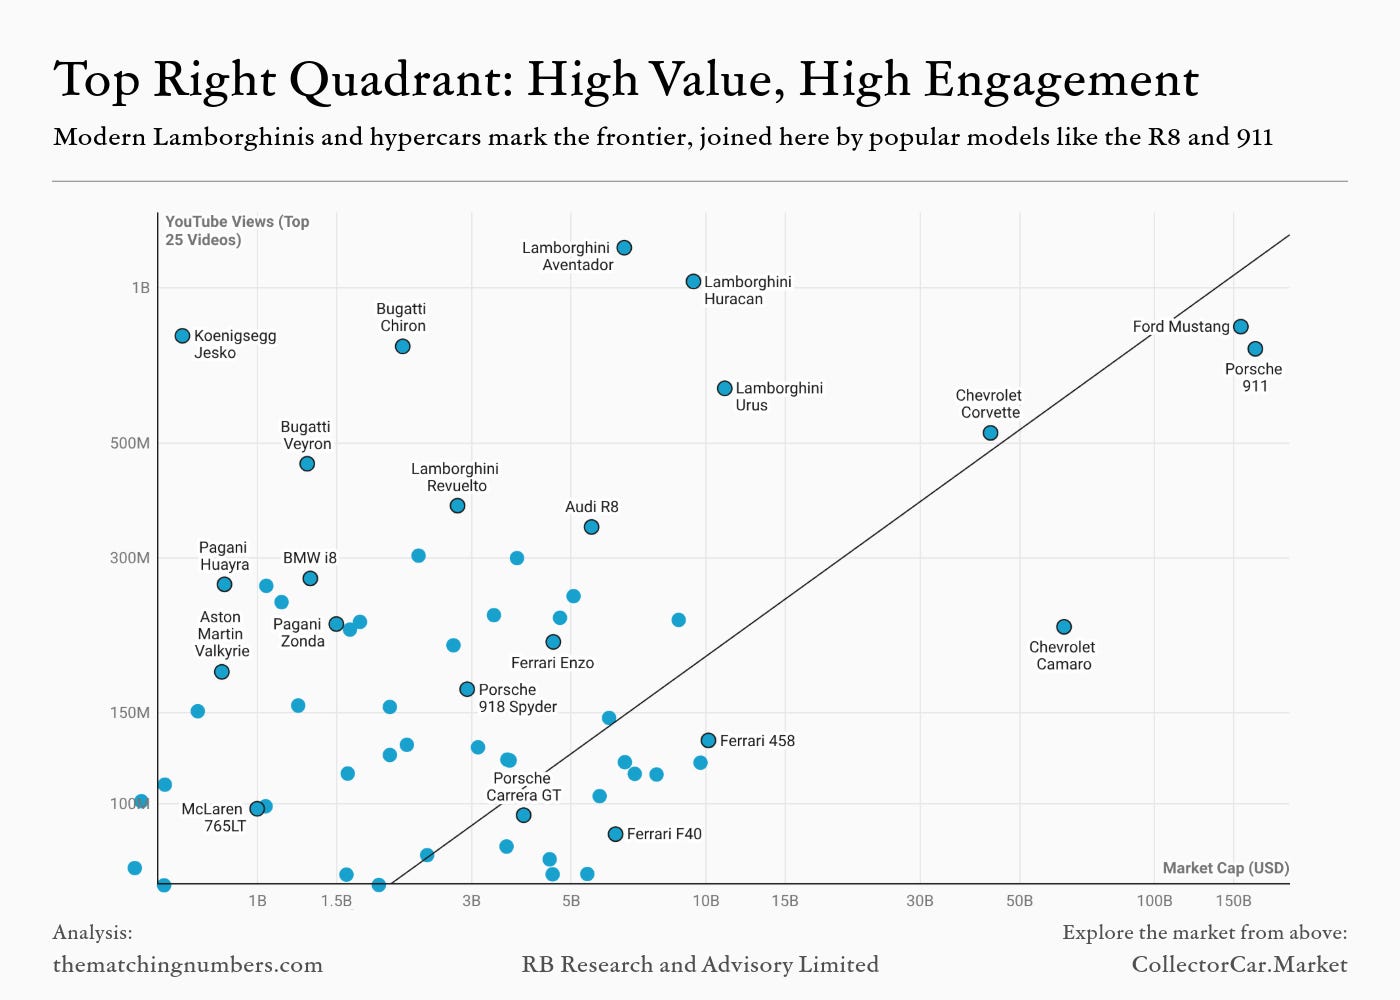
The data demonstrates a clear positive relationship between YouTube views and market cap: when presented on a log scale, the 196 datapoints cluster around an upward (power) trendline. Furthermore, the positioning of individual models is intuitive while providing some interesting counter-narratives to the current market environment.
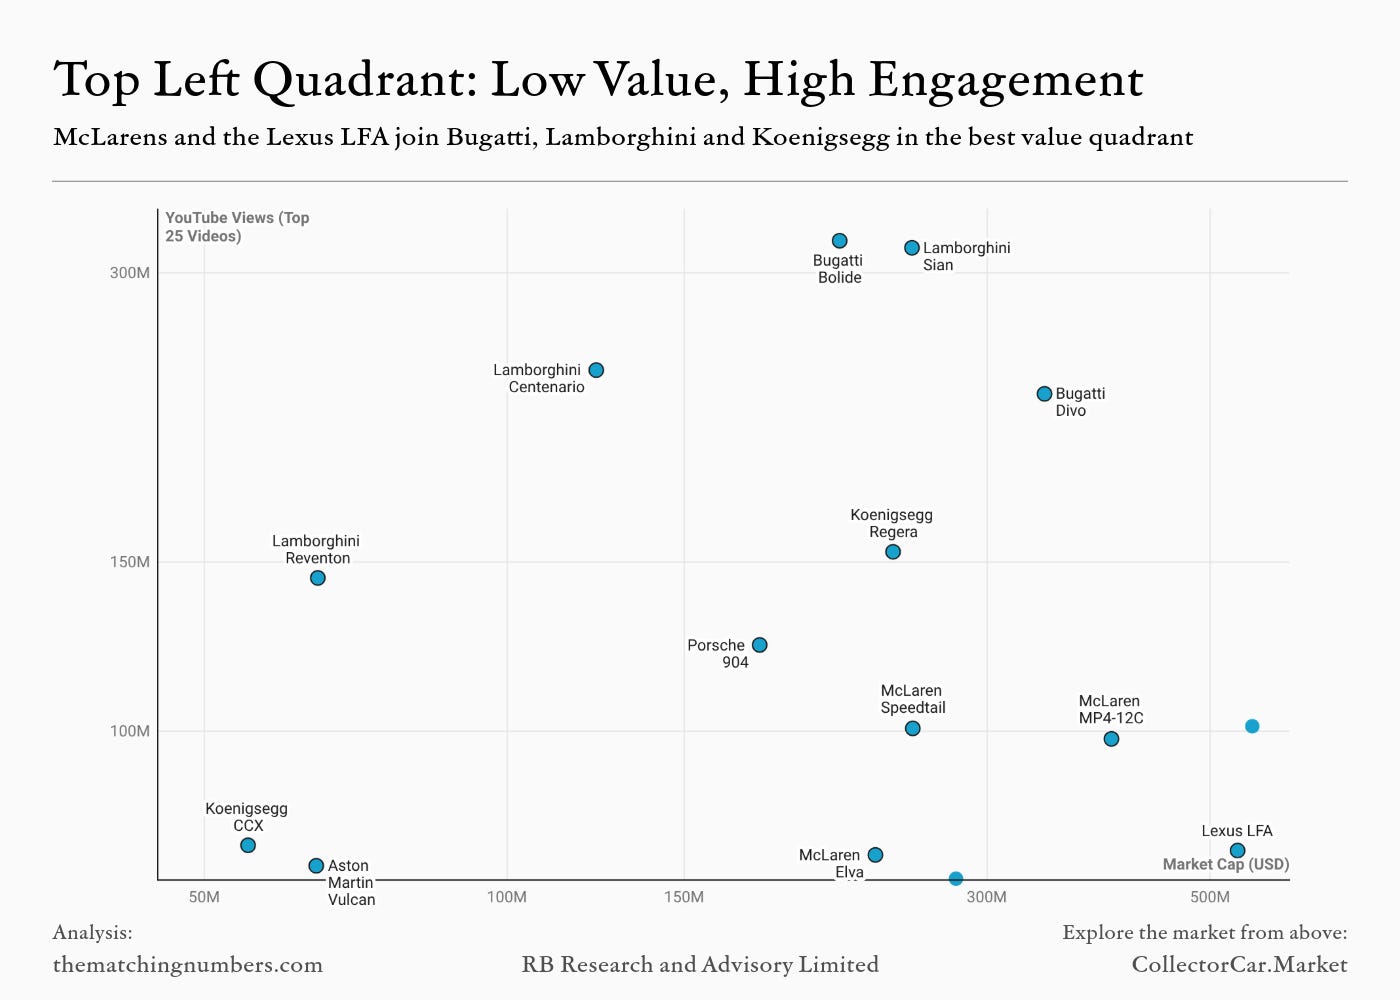
The chart can be split into quadrants to show the four broad combinations of high/low engagement and market value. Perhaps most interestingly, the top left shows small markets with high engagement, implying that the cars may offer good value for their cultural relevance. The large number of YouTube views here could prove a long-term tailwind for demand.
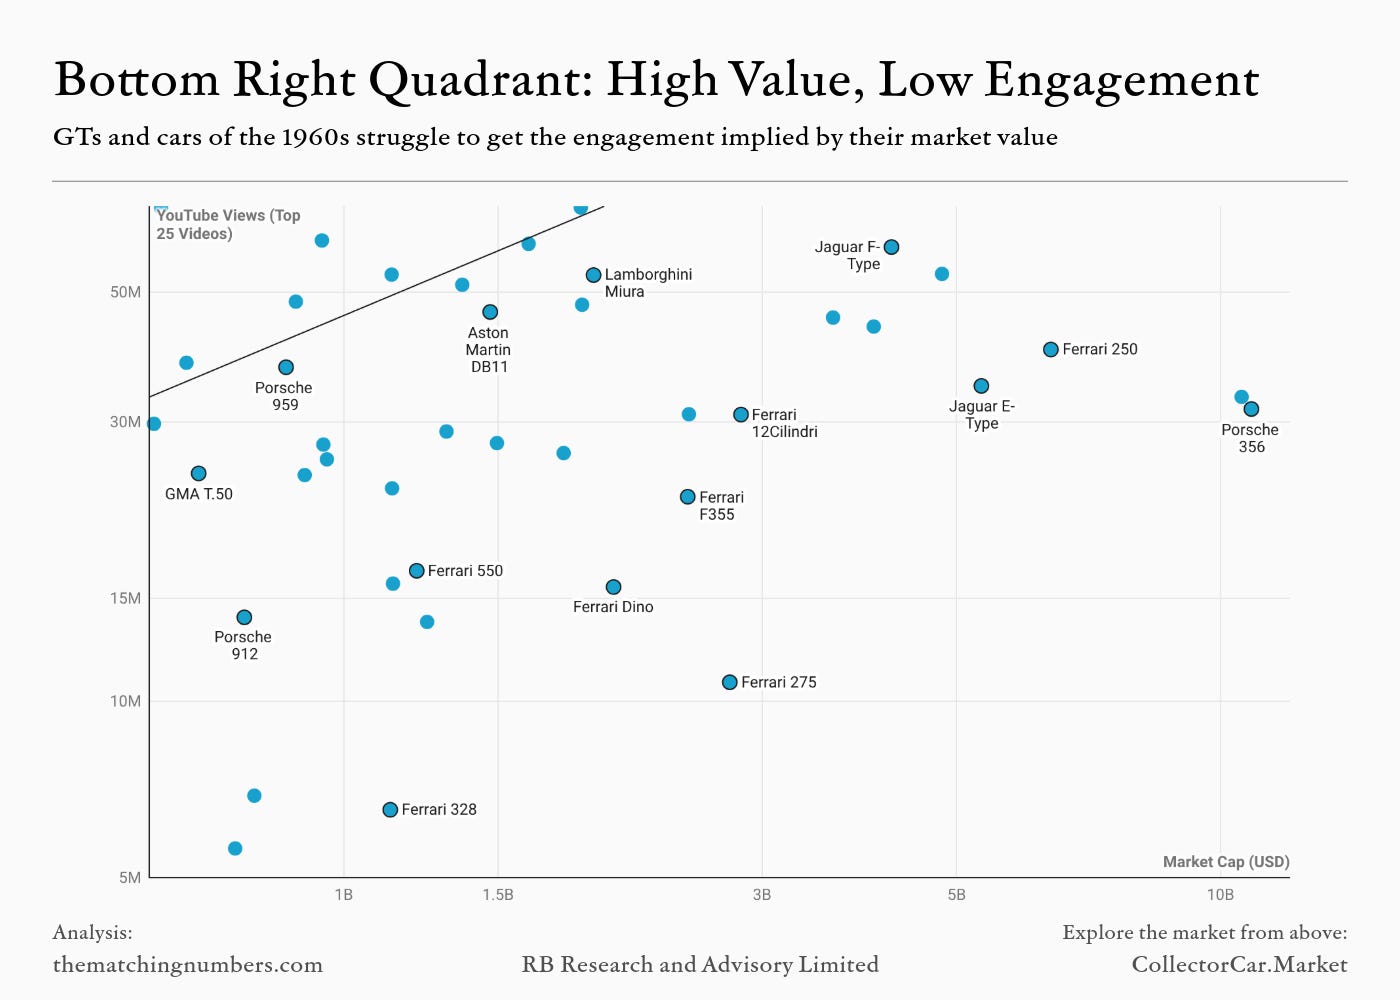
In the opposite corner, the bottom right quadrant shows models which the market values highly that do not attract commensurate attention on YouTube. This may imply a long-term headwind for demand. It is not surprising to see some of the oldest cars here, many from the 1960s which are already in bear markets.
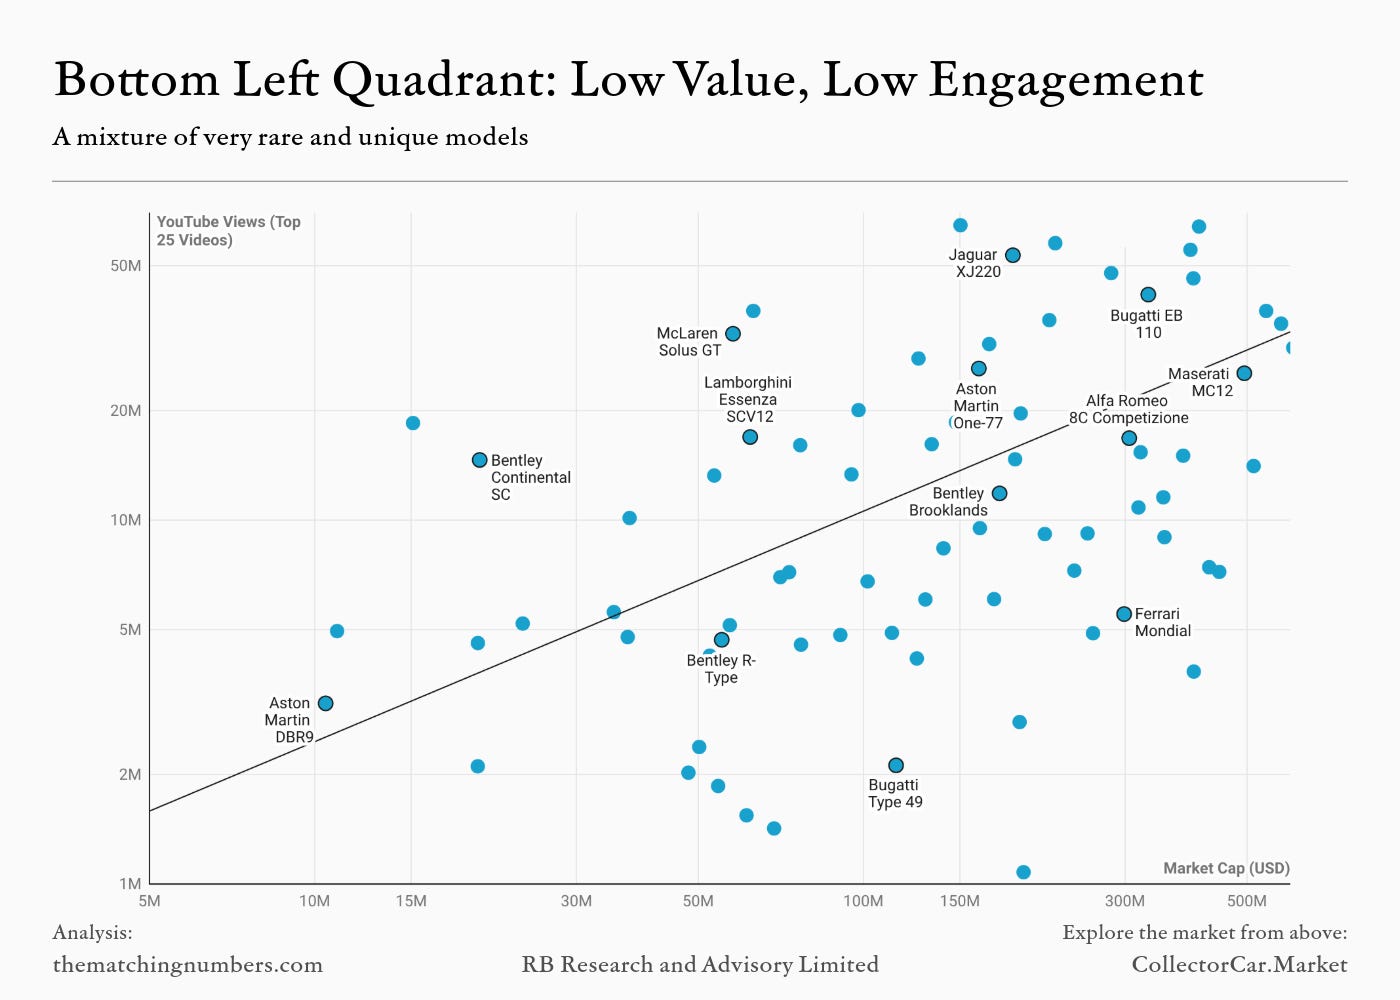
The bottom left and top right quadrants are split by the line of best fit. In general, cars which demonstrate value for their YouTube relevance sit above the line while those which are expensive for their relevance sit below.
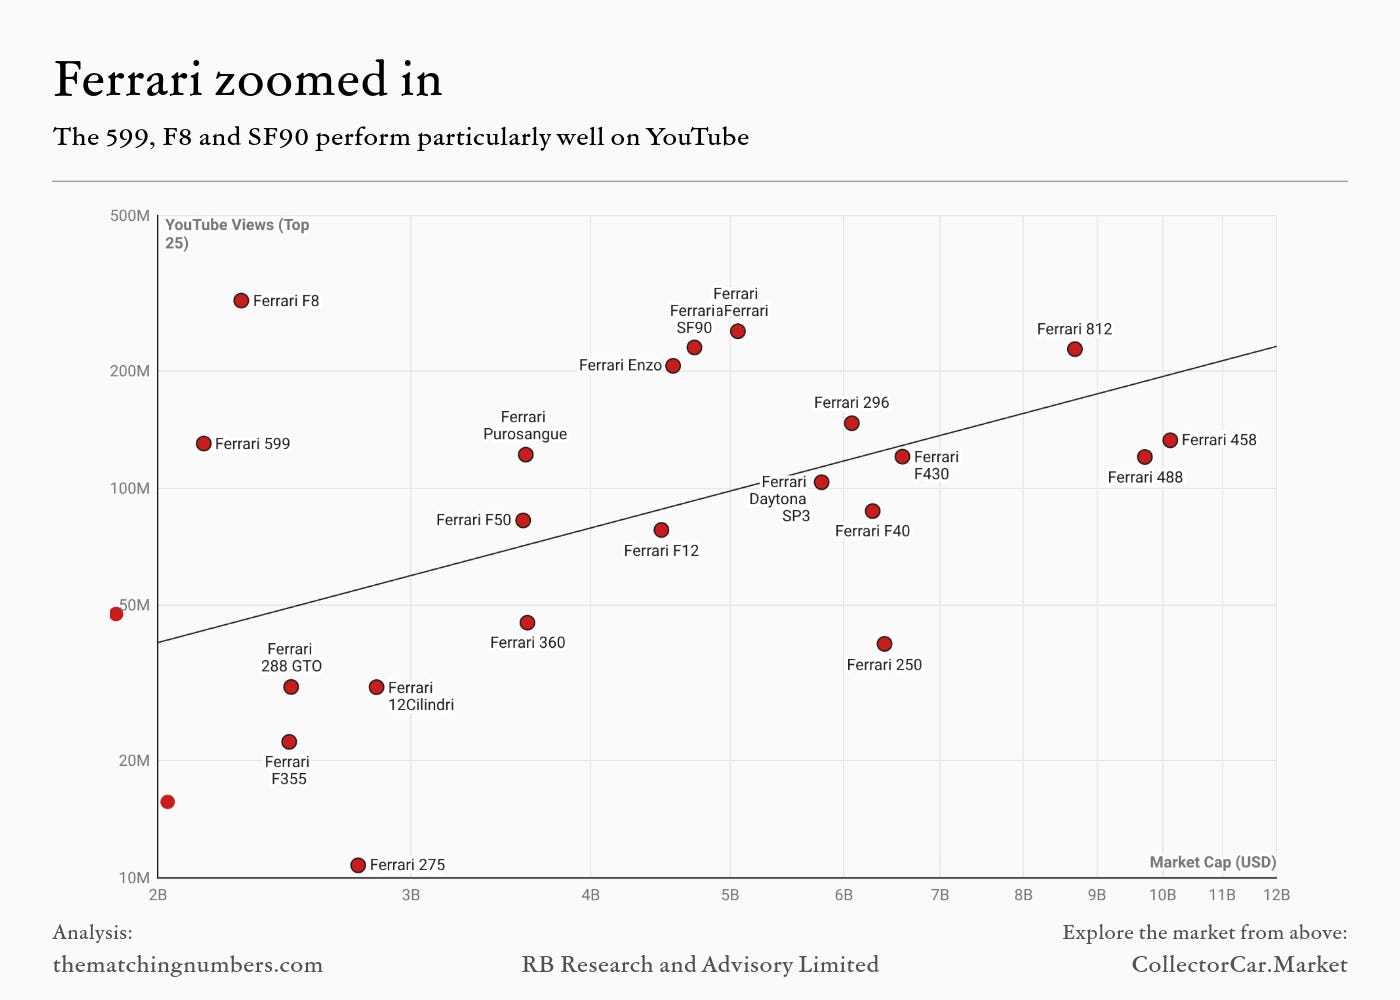
The chart of Ferraris below shows this market cap-YouTube views relationship across different genres and eras cleanly. Apart from the general underperformance of pre-1970s cars on YouTube, few other relationships are immediately obvious. In fact, across the dataset, oft-mentioned variables like cylinder count are not statistically significant. However, the chart is still informative of the brand’s cars where sentiment in the market is stronger than on YouTube (bottom right) and vice versa (top left).
Multivariate regressions can be used to quantify the values of the different brands, identify which factors are most important in explaining the relationships and adjust for composition effects. For example, the most basic analysis will underestimate the value of the Bugatti brand because its pre-war cars attract far less attention on YouTube than its modern hypercars.
Two models have been created, both adjusting for power and age, important and collinear variables (newer cars tend to have higher horsepower). In the first, the power and age for each car is calculated using the most common generation (for example, the weighted average of all variants of the VH generation Vantage). In the second model, power is the weighted average across all generations and age is split into four binary variables for era, so a long-standing model like the 911 is considered across classic, modern and current eras (not pre-war). The statistical fit (R2 = 0.8) and coefficients of both models are almost identical.
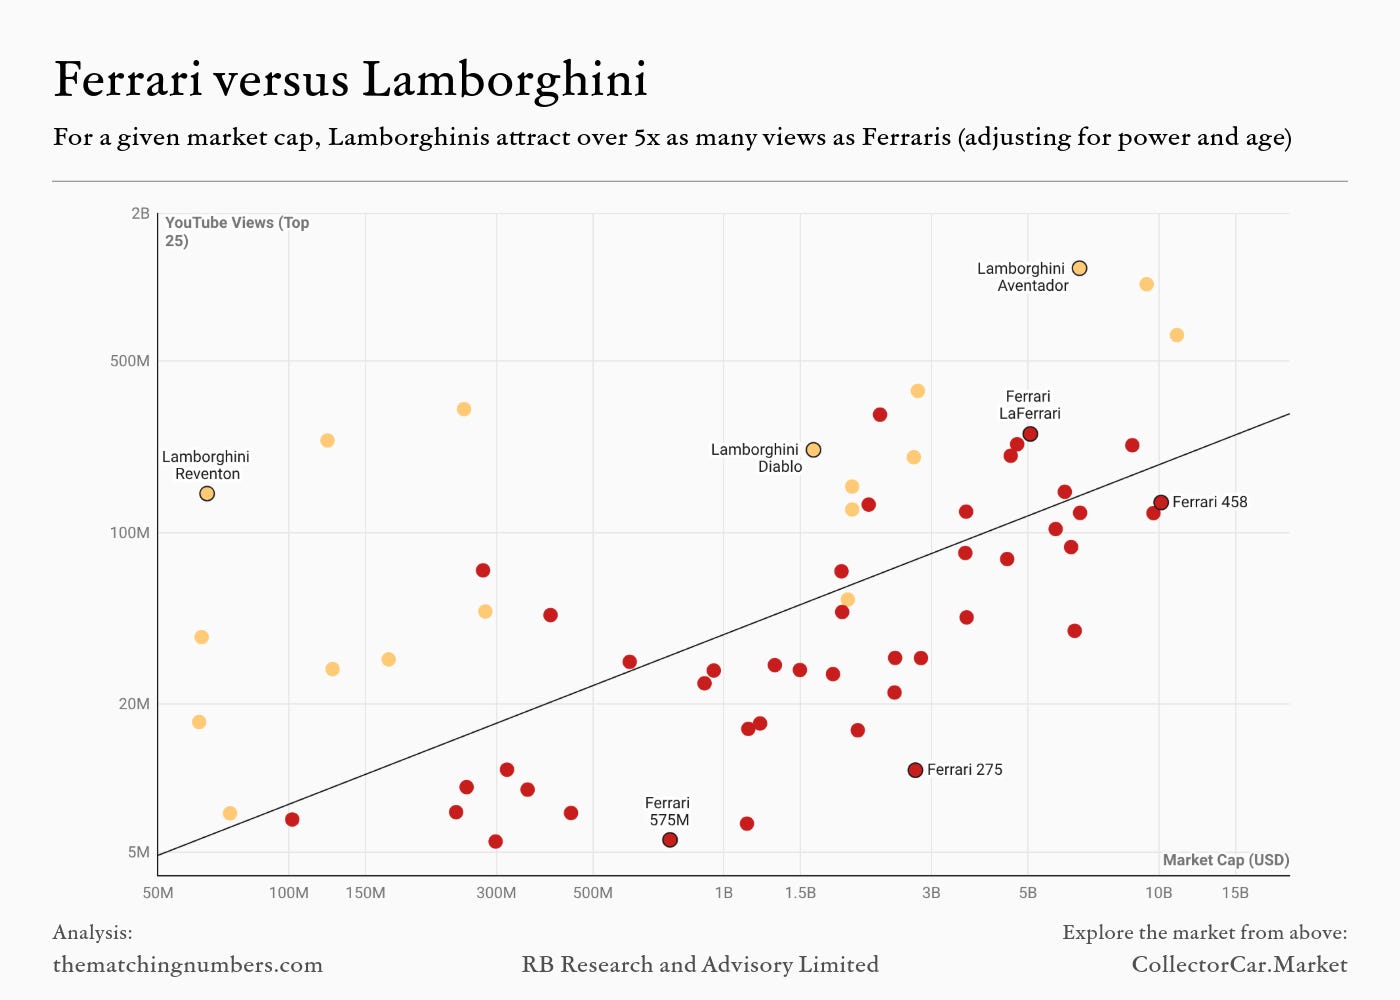
The results of these regressions show that Ferrari has by far the highest market cap for a given level of engagement, adjusting for power and age. Put the other way, the number of YouTube views of Ferraris is low considering these factors).
Each dollar of Porsche market cap is associated with 1.7x as many views, all else equal. However, the starkest comparison is arguably with Lamborghini: for each dollar of market cap, Lamborghini videos attract 5.5x as many views as Ferrari videos. This implies that Ferraris may be fully priced and that there should be long-term support for Lamborghini valuations, as the size of their following is disproportionate to their market cap.
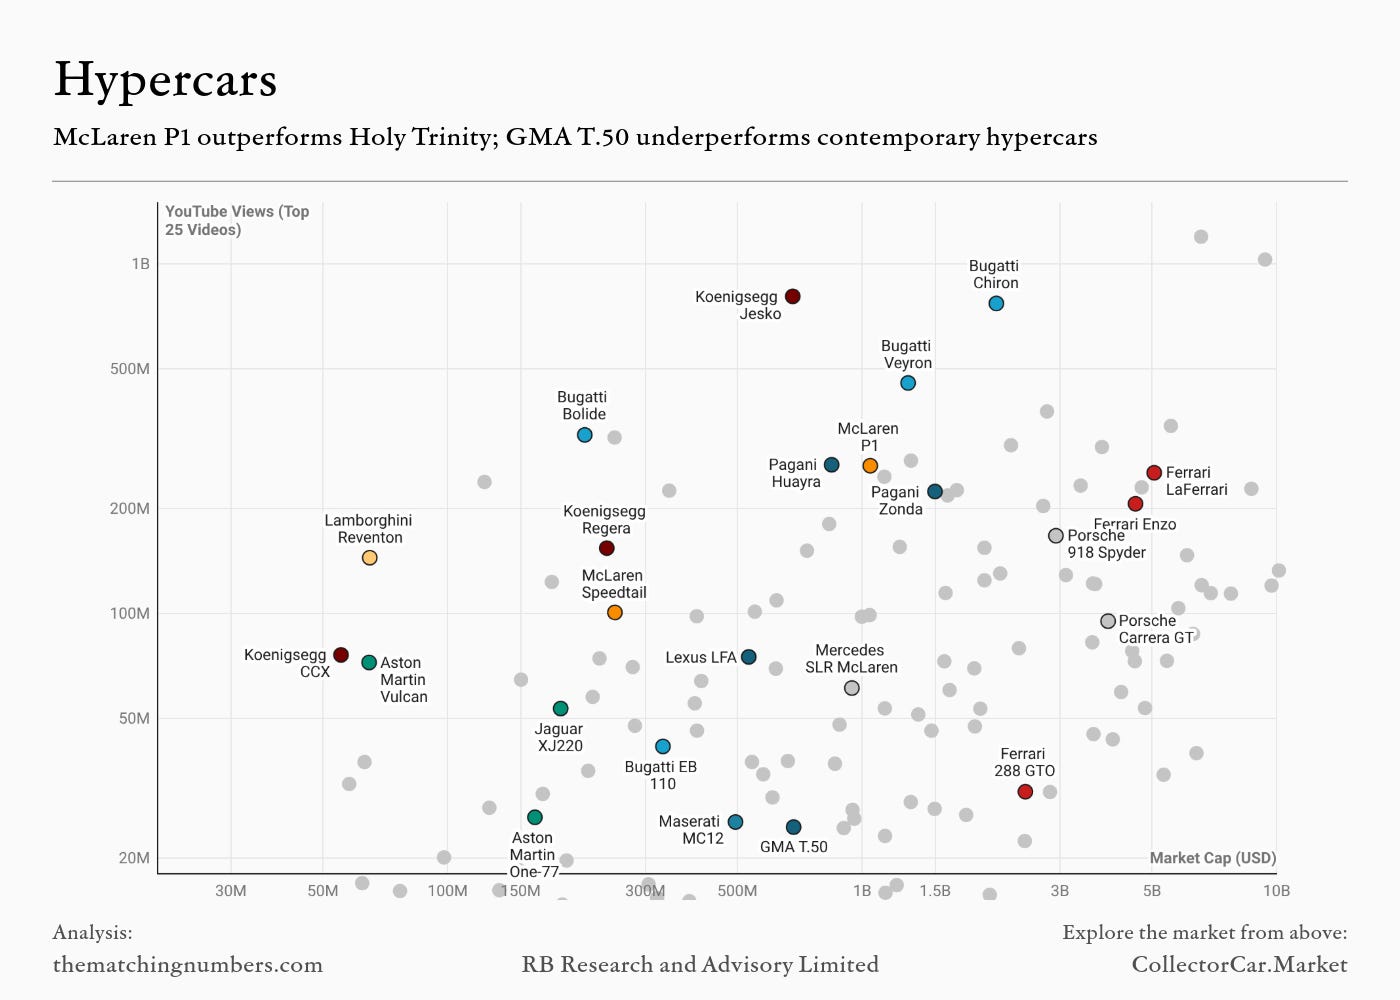
Most hypercars are very strong on YouTube, with Bugattis and Koenigseggs along the frontier. A notable exception is the GMA T.50, which has attracted only a modest number of views in comparison, and perhaps highlights the gap between current collectors and the broad global enthusiast base. To some extent this is an inevitable consequence of its subtle design, deliberately eschewing the visual drama of many other hypercars; its long-term value is supported by heritage and driver engagement. Otherwise, of the Holy Trinity, the McLaren P1 stands out with both the greatest YouTube engagement and lowest market cap.
Overall, the relationship between YouTube views and market cap is strong, with a 10x change in market cap corresponding to a ~3.7x increase in views. Interestingly, the effect of a car’s age on its YouTube views is very slight, while there is a clear preference for power. This data implies that YouTube views scale proportionally to power: a car with 1,000bhp will attract double the number of views of a car with 500bhp, everything else equal. While many enthusiasts lament the commoditisation of very high-power output, this dataset (which does not include EVs) shows that the most powerful cars still attract the most attention. Nonetheless, the individual relative value inside the charts, and the stark out-performance of Lamborghini over Ferrari, are perhaps the most pertinent findings for collectors and investors.